- Monthly Bills: (including Rent, Utilities, Internet, Phone and Transit)
- January: $962.90 – We we forced to buy rental insurance for the first time. Streak broken 🙁
- February: $965.64
- March: $911.94
- Average: $946.83 – 6% increase compared to Q1 2017 based on increased rent and rental insurance
- Groceries:
- January: $158.53
- February: $93.93
- March: $134.14
- Average: $128.87 – A $15.95 average per month increase compared to last year. I’ve been living large with more fruit like a princess!
- Eating Out :
- January: $42.06
- February: $64.57
- March: $130.46 – We went wild this month, taking advantage of a Wagyu beef special, going to brunch and while my partner was away I went out with lots of friends
- Average: $79.37 – A $30.44 average per month increase. Uh oh – I’ll need to keep an eye on this 🙂
- Alcohol:
- January: $57.15
- February: $43.92
- March: $85.48 – My partner was gone for a week so I went out with friends more than usual
- Average: $69.13 – A $45.71 average per month increase, which isn’t surprising since I was extremely focused on weight loss this time last year and not drinking basically at all was part of that
- Parties:
- January: $6.50
- February: $0!
- March: $39.46
- Average: $15.32 – 53% increase. Guess I’ve been having more fun.
- Giving
- January: $25
- February: $0
- March: $0
- Average: $8.33 – A 89% decrease and a vast improvement!
- Household Goods
- January: $8.15
- February: $15.01- Including our first purchase of Drano! We’re such adults
- March: $16.19 – Batteries are expensive!
- Average: $13.12 – A $6.31 increase is a small price to pay for being adults
- Personal Products
- January: $0!
- February: $6.50
- March: $10.25
- Average: $5.58 – A 513% increase
- Entertainment
- January: $11.50 – Bought a childhood favorite game: Age of Empires while it was 75% off
- February: $16.82 – Black Panther theater ticket and Blade Runner 2049 Redbox
- March: $30.48 – Sims 4 Cats & Dogs! Coco and Jumanji on Redbox
- Average: $19.60 – A 94% increase that accounted to a lot of fun!
- Furniture
- January: $0
- February: $0
- March: $137.62 – We bought a portable air conditioner to make Seattle’s increasingly hot summers bearable. Look at us being so fancy!
- Average: $45.87 – This is a new category so we’ll see how it goes!
- Grass
- January: $18
- February: $0
- March: $0
- Average: $6 – Weed is legal in Washington
- Medical
- January: $13.75 – I was sick for 24 hours and loaded up on sugar free cough drops and drugs for the flight home
- February: $0
- March: $0
- Average: $4.58 – Not bad. Let’s keep sickness away
- Vacation Spending
- January: $49.26
- February: $191.77 – Singapore
- March: $0
- Average: $80.31 – $35 less than last year!
- Travel
- January: $446.40 – Roundtrip summer flight to ATL for 2 weeks
- February: $775.70 – Christmas flight: 2 weeks ATL, 1 week HF
- March: $0
- Average: $407.37 – A 30% decrease from last year!
Q1 AVERAGE SPENDING: $1,837.42 (3% less than last year!)
– Minus flights: $1,430.06
I’m planning to pay for all my remaining flights this year with points (Costa Rica and Ireland) so despite increased spending in some areas, based on the averages I’m on track to spend $18,382.80! That’s $53.80 less than last year and closer to my $18,000 goal. While looking at the increases above I thought I was way off target, but it turns out I’m not! I guess keeping most of the largest expenses (housing, transit, food) pretty low really does help! Since March was a bit of an explosion of spending I think I could probably buckle down and knock those extra costs to reach my goal, but I’m not sure I want to 🙂 .
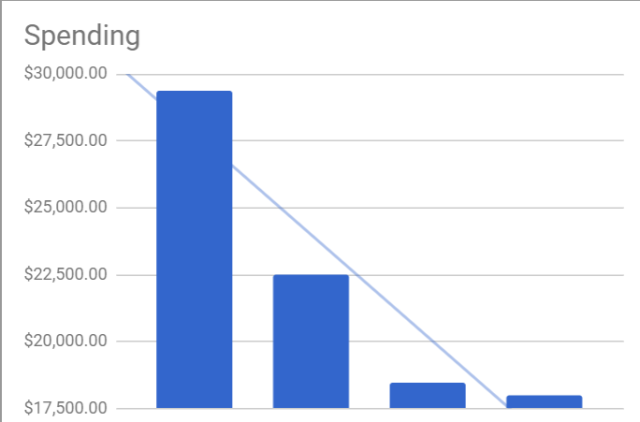
Originally when I saw that I hadn’t decreased much from last year I was disappointed and then I remembered: I’ve been insanely good at decreasing my spending year over year. Below is a snapshot of what I’ve done. From 2015 to 2016 I decreased 23%, from 2016 to 2017 I decreased another 18%. If I buckle down and decrease from my projected $18,382.80 to a straight $18,000 that’s only a 2% decrease for a lot of extra effort. Seeing these facts I don’t think it’s worth it. Look at me go being less neurotic and using facts to focus my efforts! It’s all good because I used my 2017 numbers to come up with my latest Retirement Budget and even adding World Nomads travel insurance, Traveling Mailbox for my nomad mail needs and lots of extra money for food, alcohol and fun I’m still under $20,000 annual spend. Time to chill out.
To next quarter!
UPDATE: A few weeks after writing this I realized that I have been striving for this $18,000 since the beginning of 2017 and haven’t adjusted for inflation! So my goal for this year is to spend $18,3600 ($18K+2% inflation). I’ll be using that number moving forward.
Discover more from A Purple Life
Subscribe to get the latest posts sent to your email.


