So I know inflation is wild at the moment – or at least wilder than we’re used to in the US. However, there is a difference between what the Consumer Price Index (CPI) says the inflation amount is and my costs, since I don’t buy a lot of things the CPI mentions.
Yes, those costs can be passed to me in other ways, but overall, I’ve suspected that my global nomadic lifestyle doesn’t have the same level of inflation that is listed in the CPI and am curious to see if that’s true. So let’s see if I’m right or wrong 🙂 .
I want to answer this question, but I also know that the very lifestyle that helps protect me from the full brunt of inflation also makes it hard to quantify since I move every month to different states and even countries that have wildly different costs of living. I guess I couldn’t make it easy on myself 🙂 .
When planning this post, I even reached out to y’all to see if you had any ideas of how to best do this fairly:
I want to do an Inflation Spending Comparison of my spending in 2020, 2021 & 2022, but I don't know how to accurately compare these since I was in different states and countries during that time where spending varies wildly. Is there a way to do this fairly🤷🏾♀️? All ideas welcome. pic.twitter.com/zvCuOWAWZU
— A Purple Life (@APurpleLifeBlog) November 11, 2022
And received no new ideas 🙂 . I guess I’m on my own. So let’s see what the inflation rate has been in the US the last few years and how my costs stack up.
Inflation Rates
Here are the inflation rates in the US based on the US Bureau of Labor Statistics:
2020 Inflation: 1.4%
2021 Inflation: 7%
2022 Inflation: 7.1%
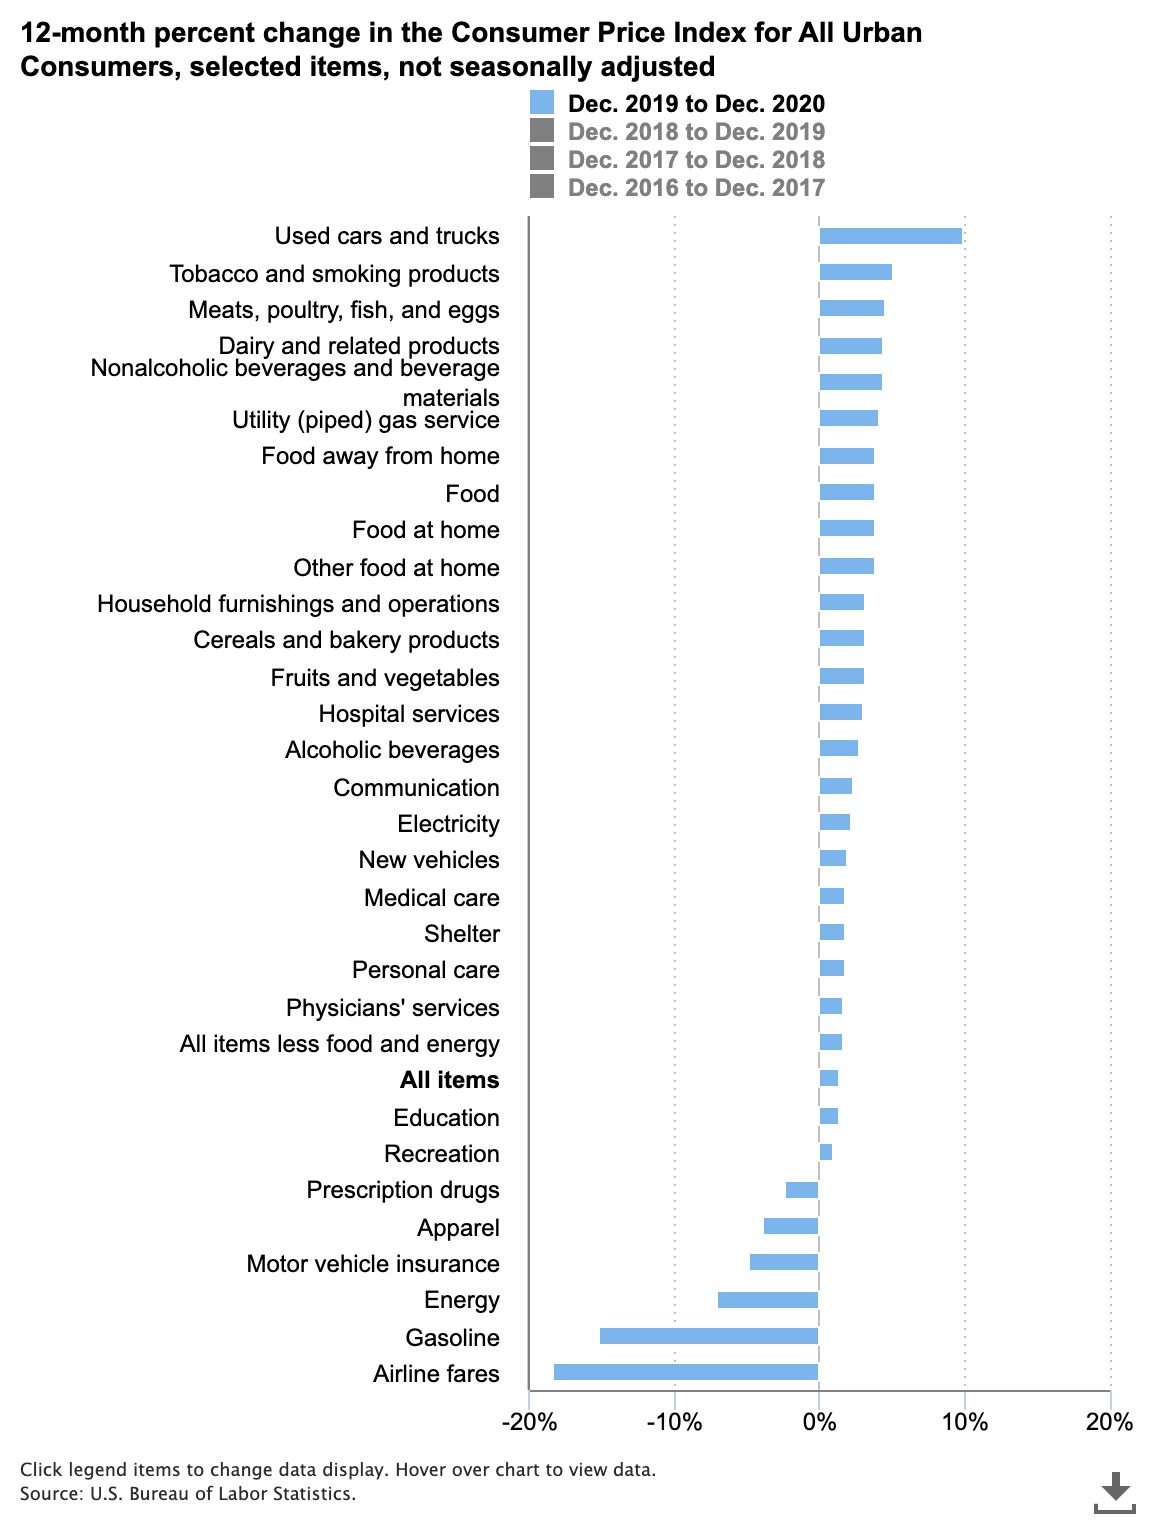
To break that down further, inflation is calculated based on increases in specific categories of goods, which is overall called the Consumer Price Index (CPI). Below is the chart to show where those increases were happening in 2020, which mostly included used cars, tobacco and food items:
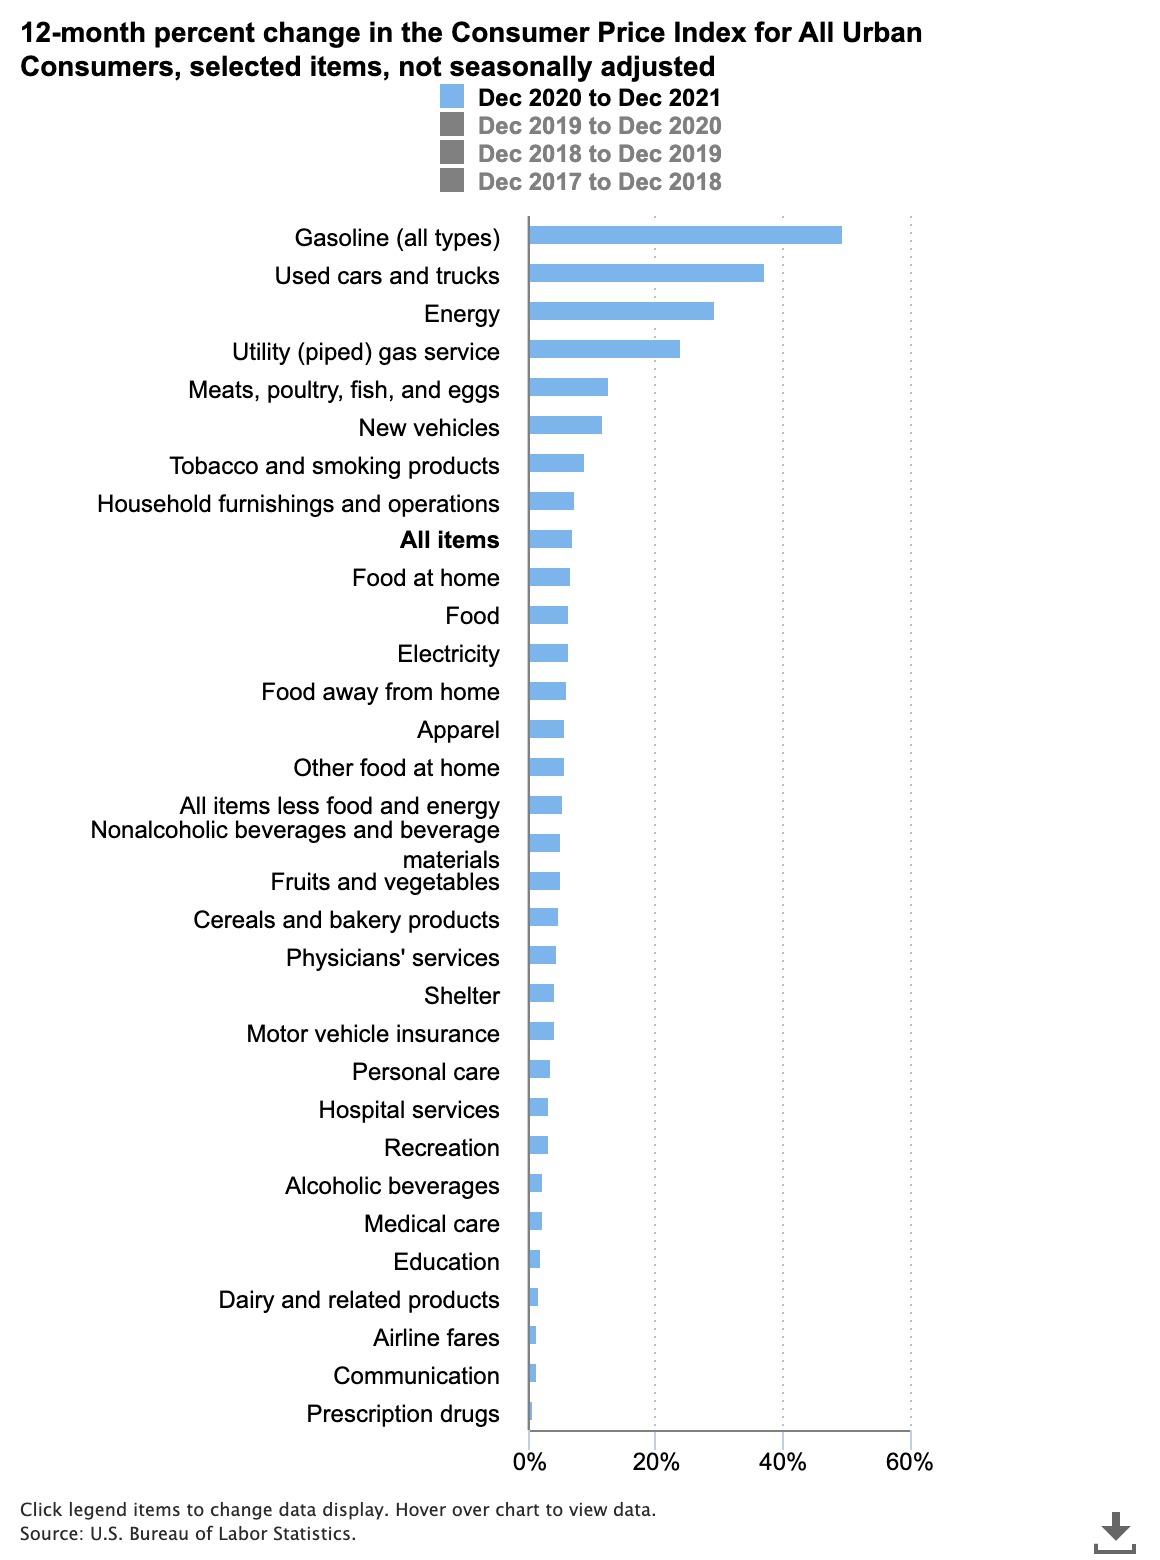
And below is where they were focused in 2021, which mostly included gas, energy and food items:
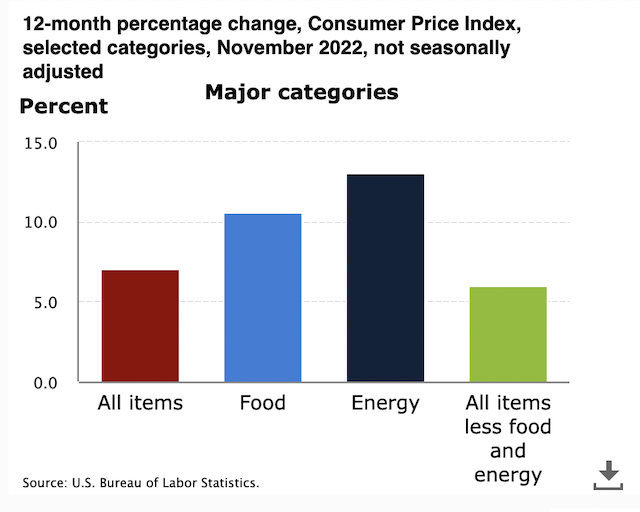
For 2022 specifically, these are the increases we’re seeing – mostly in energy (such as gas prices) and food costs:
Overall Spending
So let’s get into how my costs have changed over these years:
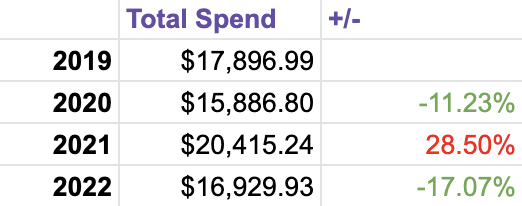
Hmm…that doesn’t look right 🙂 . Based on the inflation numbers above, I expected costs to have been going up overall year to year. Costs understandably increased in 2021 as I actually started to leave my house, but they dropped again in 2022. Let’s dive into the numbers to see why that might be.
Rent
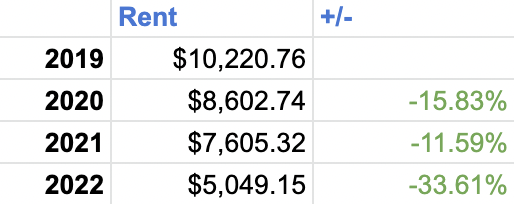
My living costs decreased slightly in 2020 after I moved into a tiny house in rural Georgia to wait out the pandemic in the Fall 2020. I stayed there until Spring 2021 when I started traveling around the US.
In 2022 I continued traveling, but also started leaving the country to places that happen to have a cheaper cost of living than the US (Argentina, Thailand, México). I also started housesitting a little for friends and family. I go through the number of days I did that compared to paying for an Airbnb in my annual spending posts, but overall I’m shocked. There’s a surprising difference in what I spent living in 1 apartment in Seattle in 2019 to living in different countries and states while overall spending less on housing. Nice 🙂 .
Food
So that’s all well and good, but what about food – the category that topped the charts of areas that experienced the most inflation these last few years?
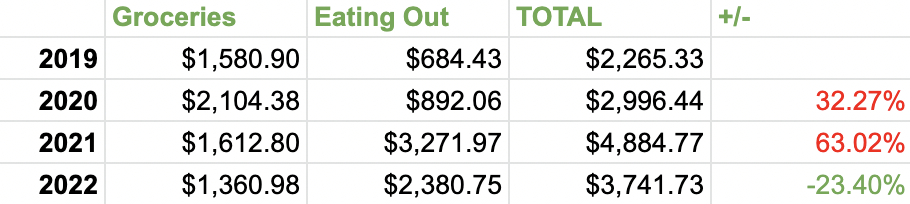
Nope 🙂 . The amount of takeout I got (and amount of tips I gave) increased in 2020 and increased further in 2021 when I started traveling and sampling local cuisines. However, after a quick increase in 2020, my grocery costs have been pretty consistent and even decreased in 2022 along with my restaurant costs. So what gives? 🙂
I suspect this is another impact of me traveling to lower cost of living countries this year. Despite feeling like I was eating at restaurants all the time, the cost of doing so was vastly different in Phuket, Thailand than it was in Seattle, Washington. I didn’t expect those differences to be that stark, but they seem to be. My food costs decreased by almost 25% in 2022 when they should have risen at least 10% according to the CPI.
Travel
Then what about travel or ‘energy’ as the CPI refers to it? Surely with all the traveling I do those gas prices have caught up to me?
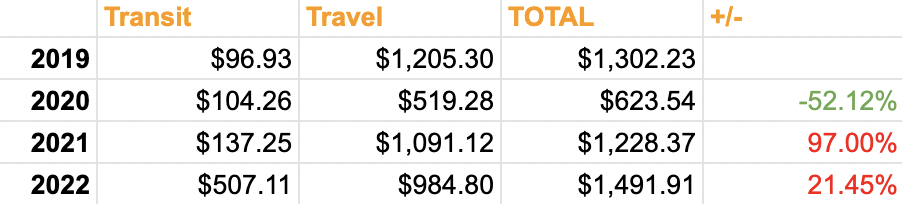
Nope 🙂 . In this case the percentage increases might be misleading, but in 2020 my travel costs were understandably cut in half when I basically didn’t leave my house. However, in 2021 they went almost, but not quite, back to 2019 levels as I started traveling. In 2022 they increased a further $263.54 as I traveled the world. These are not the results I expected from the high gas prices we’ve been experiencing and me moving every month.
Conclusion
So overall, it looks like my costs while traveling do not reflect the high increases in inflation that are shown in the US CPI. Despite traveling and eating out more often, my costs have either decreased or remained fairly steady.
I honestly expected to see at least small increases across the board since it does seem like the world is getting more expensive, but the numbers don’t tell that story. I’m curious to see how the next few years shake out inflation wise and with my spending, but until then: Let’s see what happens 🙂 !
What’s your experience with inflation been like these last few years?
Love the breakdown year over year + explaining the why of it all. I’m shocked how low some of those numbers are for 2022! Well done for geo-arbitrage. Thanks for posting this idea!
Yeah it was pretty wild 🙂 . Thank you for reading!
Nice post, I always enjoy seeing the “numbers” of people’s retirement whether they be savings rates leading up to or SWRs, et cetera. It’d be interesting to know how you think your efficiency in travel has improved over the years as that might shed some light on why your year to year costs did not keep pace with inflation (apologies if you explain this elsewhere, new to your blog). Data on average length of stay or other cost saving improvements you learned over time may be interesting to hear. Kudos on retirement and the blog, I’ve just began traveling myself. 🙂
I love numbers too 🙂 . I haven’t seen my travel efficiency increase yet, but it’s only Year 3. Maybe I’ll find some going forward 🙂 . I posted the data on how many days I was in each type of housing situation with spending averages in the Annual Spending post I linked above, but here are the copy/pasted numbers:
Airbnb
Number of Days: 162
Rent & Utilities Average: $935.03/month
House/Baby/CatSitting
Number of Days: 56
Rent & Utilities Average: $0
Staying with Friends/Family
Number of Days: 147
Overall I have been spending more time visiting people, which costs less since I’m not also paying rent at home. Also this year people have started asking me to house sit for them, which provides free lodging as well. In addition to that, living in LCOL countries helped cut my costs as well.
Gotcha, well it does seem you’re getting more efficient with staying with friends and doing housesits. I may just be too selfish with my time to tie myself down with housesits (oh the horror! j/k), but we’ll see. Certainly a great way to reduce one of our biggest costs. Here’s to happy travels in the New Year!
Fair point 🙂 . Happy travels!
Interesting and thank you for breaking it down into details.
I don’t think you will be able to analyze inflation the way you intended at the beginning of this post. Simply put, a large part of your retirement plan was geoarbtiraging. Your spending plan remains to be the framework of your travels. If during planning, you saw that a destination will cost above your typical spending you would likely have picked a different place.
Side question: what are your thoughts on the overall effect of georbitrage in terms of environmental impact, displacing locals, helping the local economy etc. There are pros and cons to both the visitors and the local population.
Yeah it was a challenge. However, if I do want to visit a HCOL location I still do it 🙂 . I do keep an eye on that though.
As for the impacts of geoarbitrage: My general thoughts are that I try my best to make my visit a net good by renting from locals whenever I can, giving money to local economy (vs foreign hotels or purchasing property in another country that sits empty). As for environmental impact – I fly sparingly (I took more trains than planes last year) and do energy intensive things like driving WAY less in retirement. Overall my environmental impact in retirement has been lower travel-wise despite moving around more.
Anyway, feel free to share any resources you have about all of this if you’d like since I’m always looking for more information.
Slow travel definitely allows you to be more conscious of these impacts. With the typical American vacation, we are limited by time and other resources. Thank you for your thoughtful response.
Yeah it seems so – and of course!
The power of geoarbitrage and not aligning with the CPI basket of goods/services spending seems to have worked well in your favor! I spent $16,545 last year and invested $56,372 (still working toward FI and had a down year despite my saving, ugh). Hoping all that investing will pay off eventually when the market recovers since I was buying at “cheaper” prices all year long. Overall, inflation has only seemed to modestly impact my spending.
Indeed it has 🙂 . Congratulations on your spending and investing – that’s amazing! Also awesome to hear inflation has only modestly impacted you as well. And hang in there – the market will come back (as I’m writing this it looks like we’re up 6% this month…Wild 🙂 ) .
How do you budget if you, say, want to stop being nomadic and move to I dunno San Francisco or Santa Monica or Boston?
Or take up a hobby like skiing, snowboarding, or mountain biking that is kind of pricey? Is there a way to hack these activities?
My budget is based on what I spent living in the middle of Seattle, which has a high cost of living. I don’t know if you can hack those activities because I haven’t looked into it, but if you ask some current people doing them they might be able to give you ideas.